December San Francisco Real Estate Insider
As we roll through the second week of December, its pretty safe to call the real estate market 97% done for the year. Although the pandemic upended the standard seasonal trends this year, the market did begin its typical “holiday season” slowdown early. November activity performed well above levels of last year, but it seems the majority of activity has dramatically slowed as of last week. Sure, there are always 11th hour buyers looking for seller desperation, but the slowdown is more dramatic than that. I'd venture to say this month will be the slowest December since the market run up started.
Since I recently published data on the San Francisco exodus of residents, I've heard from a lot of you with follow up questions as well as request for agent referrals (in those reciprocal markets). The data definitely piqued curiosity.
To follow up the San Francisco exodus, I have some more data published by the Postal Service. Who better to know who is moving where? Although the data is not super robust, it does give more insight to where people are going (as well as where they are departing from in SF). Some data points of interest:
The USPS received 124,131 change of address requests originating in San Francisco zip codes between March and November 2020.
Of the 124,131 requests, only 28% were for change of address within SF.
Zip codes with the most change of address requests (in order of # of requests): 94109, 94110, 94107 and 94103.
Top destinations outside of the Bay Area: Las Vegas is number one. Next was Palm Beach County, Fla., Seminole County, Fla., Denver, Col., and Beaverton, Ore. (again, low to no tax trends).
456 SF households relocated to Marin County. The #1 destination was Mill Valley (with an estimated 65.8% of Marin-bound households) followed by Belvedere-Tiburon, with 13.6% of households.
There were 608 change requests to San Mateo County, 453 to Alameda County and 44 relocating to Contra Costa County.
Keep in mind a "household" to the USPS can be a single resident or a large family.
Bay Area Median Prices
Back to Bay Area real estate. How do the Bay Area Counties shake out in terms of median prices? San Francisco and San Mateo have been alternating in recent years for highest median house price. San Francisco always has the highest median condo price in the region.
As referenced above, the post-Thanksgiving market has been pretty quiet with December usually being the month with the lowest number of new listings coming to market. The chart speaks for itself.
Luxury Sales Data
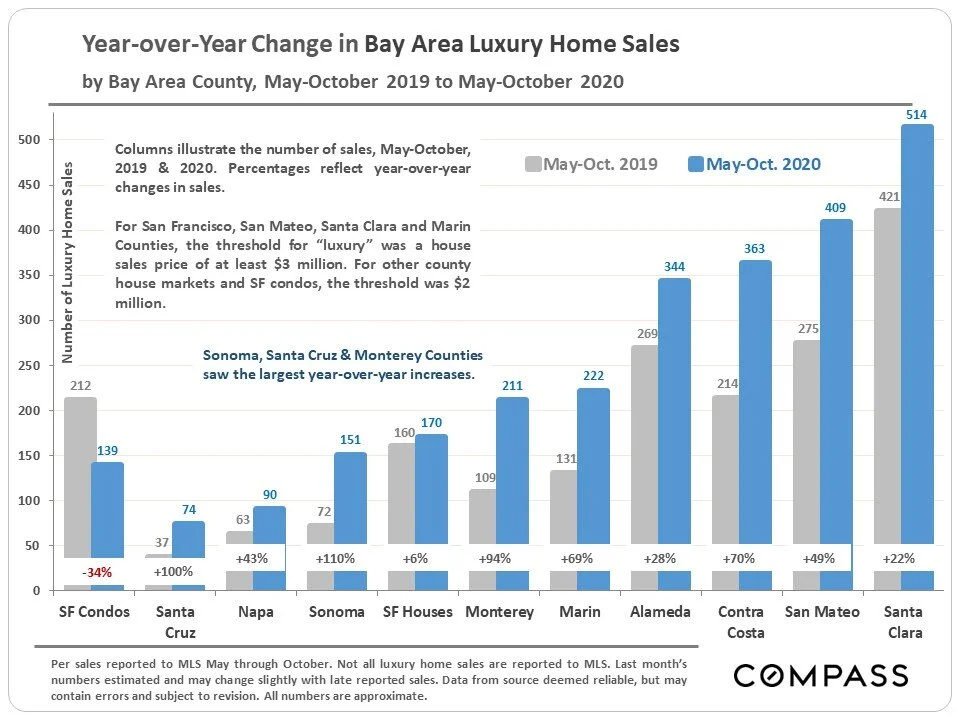
Below, the three charts and tables look at the luxury home markets of San Francisco Bay Area.
The Bay Area counties which have seen the largest percentage increases in the sales of luxury homes since May have been Sonoma and Santa Cruz (despite the fires), and Monterey. Not shown on this chart: Lake Tahoe saw a incredible 187% jump in luxury home sales.
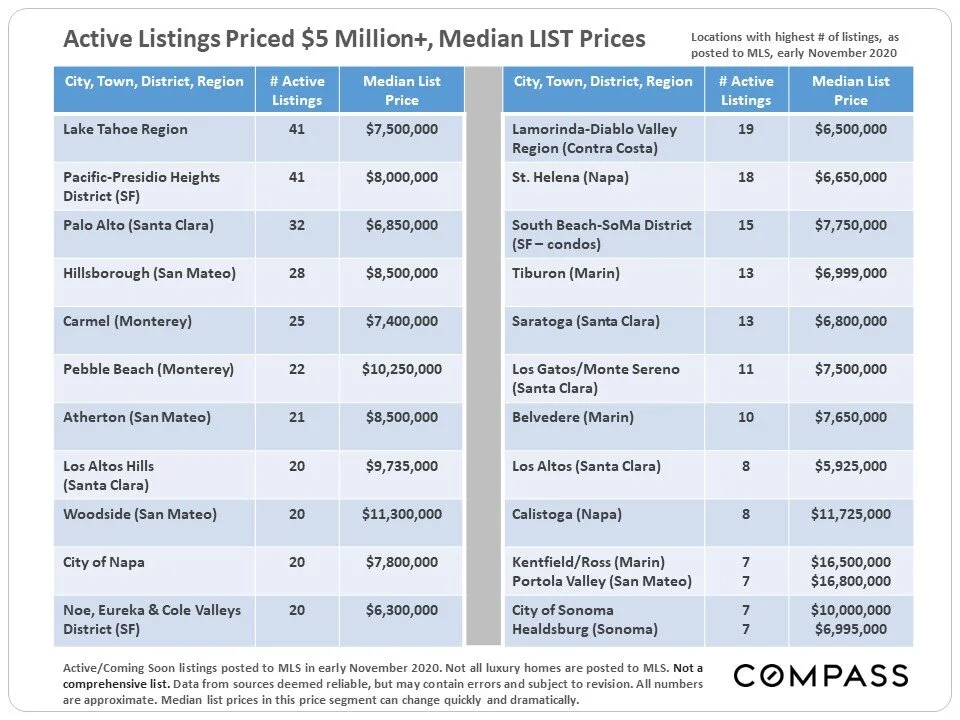
This next table looks at highest priced listings on the market in early November and the highest priced sales in the May-October period. Not reflected in this chart is a very recent sale (late Nov.) in the Sea Cliff neighborhood of San Francisco that closed at $24,000,000.
If you're looking for a home priced $5 million and above, below are the places where you will have the greatest choice of listings.


