April 2023: San Francisco Real Estate Insider
As we move into a later than usual spring, buyer demand appears stronger than it was in the previous two months. Although buyers are out and looking, the number of new listings coming on market continues to be extremely low, as many potential sellers hold off from listing their homes due to the doubling of interest rates since early 2022. This constitutes a huge factor in market dynamics and is undoubtedly holding back sales activity. Could this dynamic cause the market to heat up prematurely? We will need a couple months to see this play out.
A positive in the marketplace, taken with a grain of salt, is the drop in interest rates. The cause of the drop was clearly the Silicon Valley Bank “issue.” The SVB failure appears to have put pressure on the Fed to relax a bit on the upward pressure on interest rates. Additionally, the SVB debacle has also pushed more buyers to make all-cash offers versus financed offers. Although the Fed seems determined to backstop all losses; deposits or otherwise, the message heard was to reevaluate your own diversification strategy.
As far as what is happening in the general San Francisco market, deal flow is clearly down. If you compare ‘Q1 2022 vs. ‘Q1 2023, it’s apples and oranges. Looking at the numbers below, the data shows closed transactions are not just down, but way down. Keep in mind that in ‘Q1 2022 a buyer could get a 3% mortgage vs. ~6.5% in ‘Q1 2023.
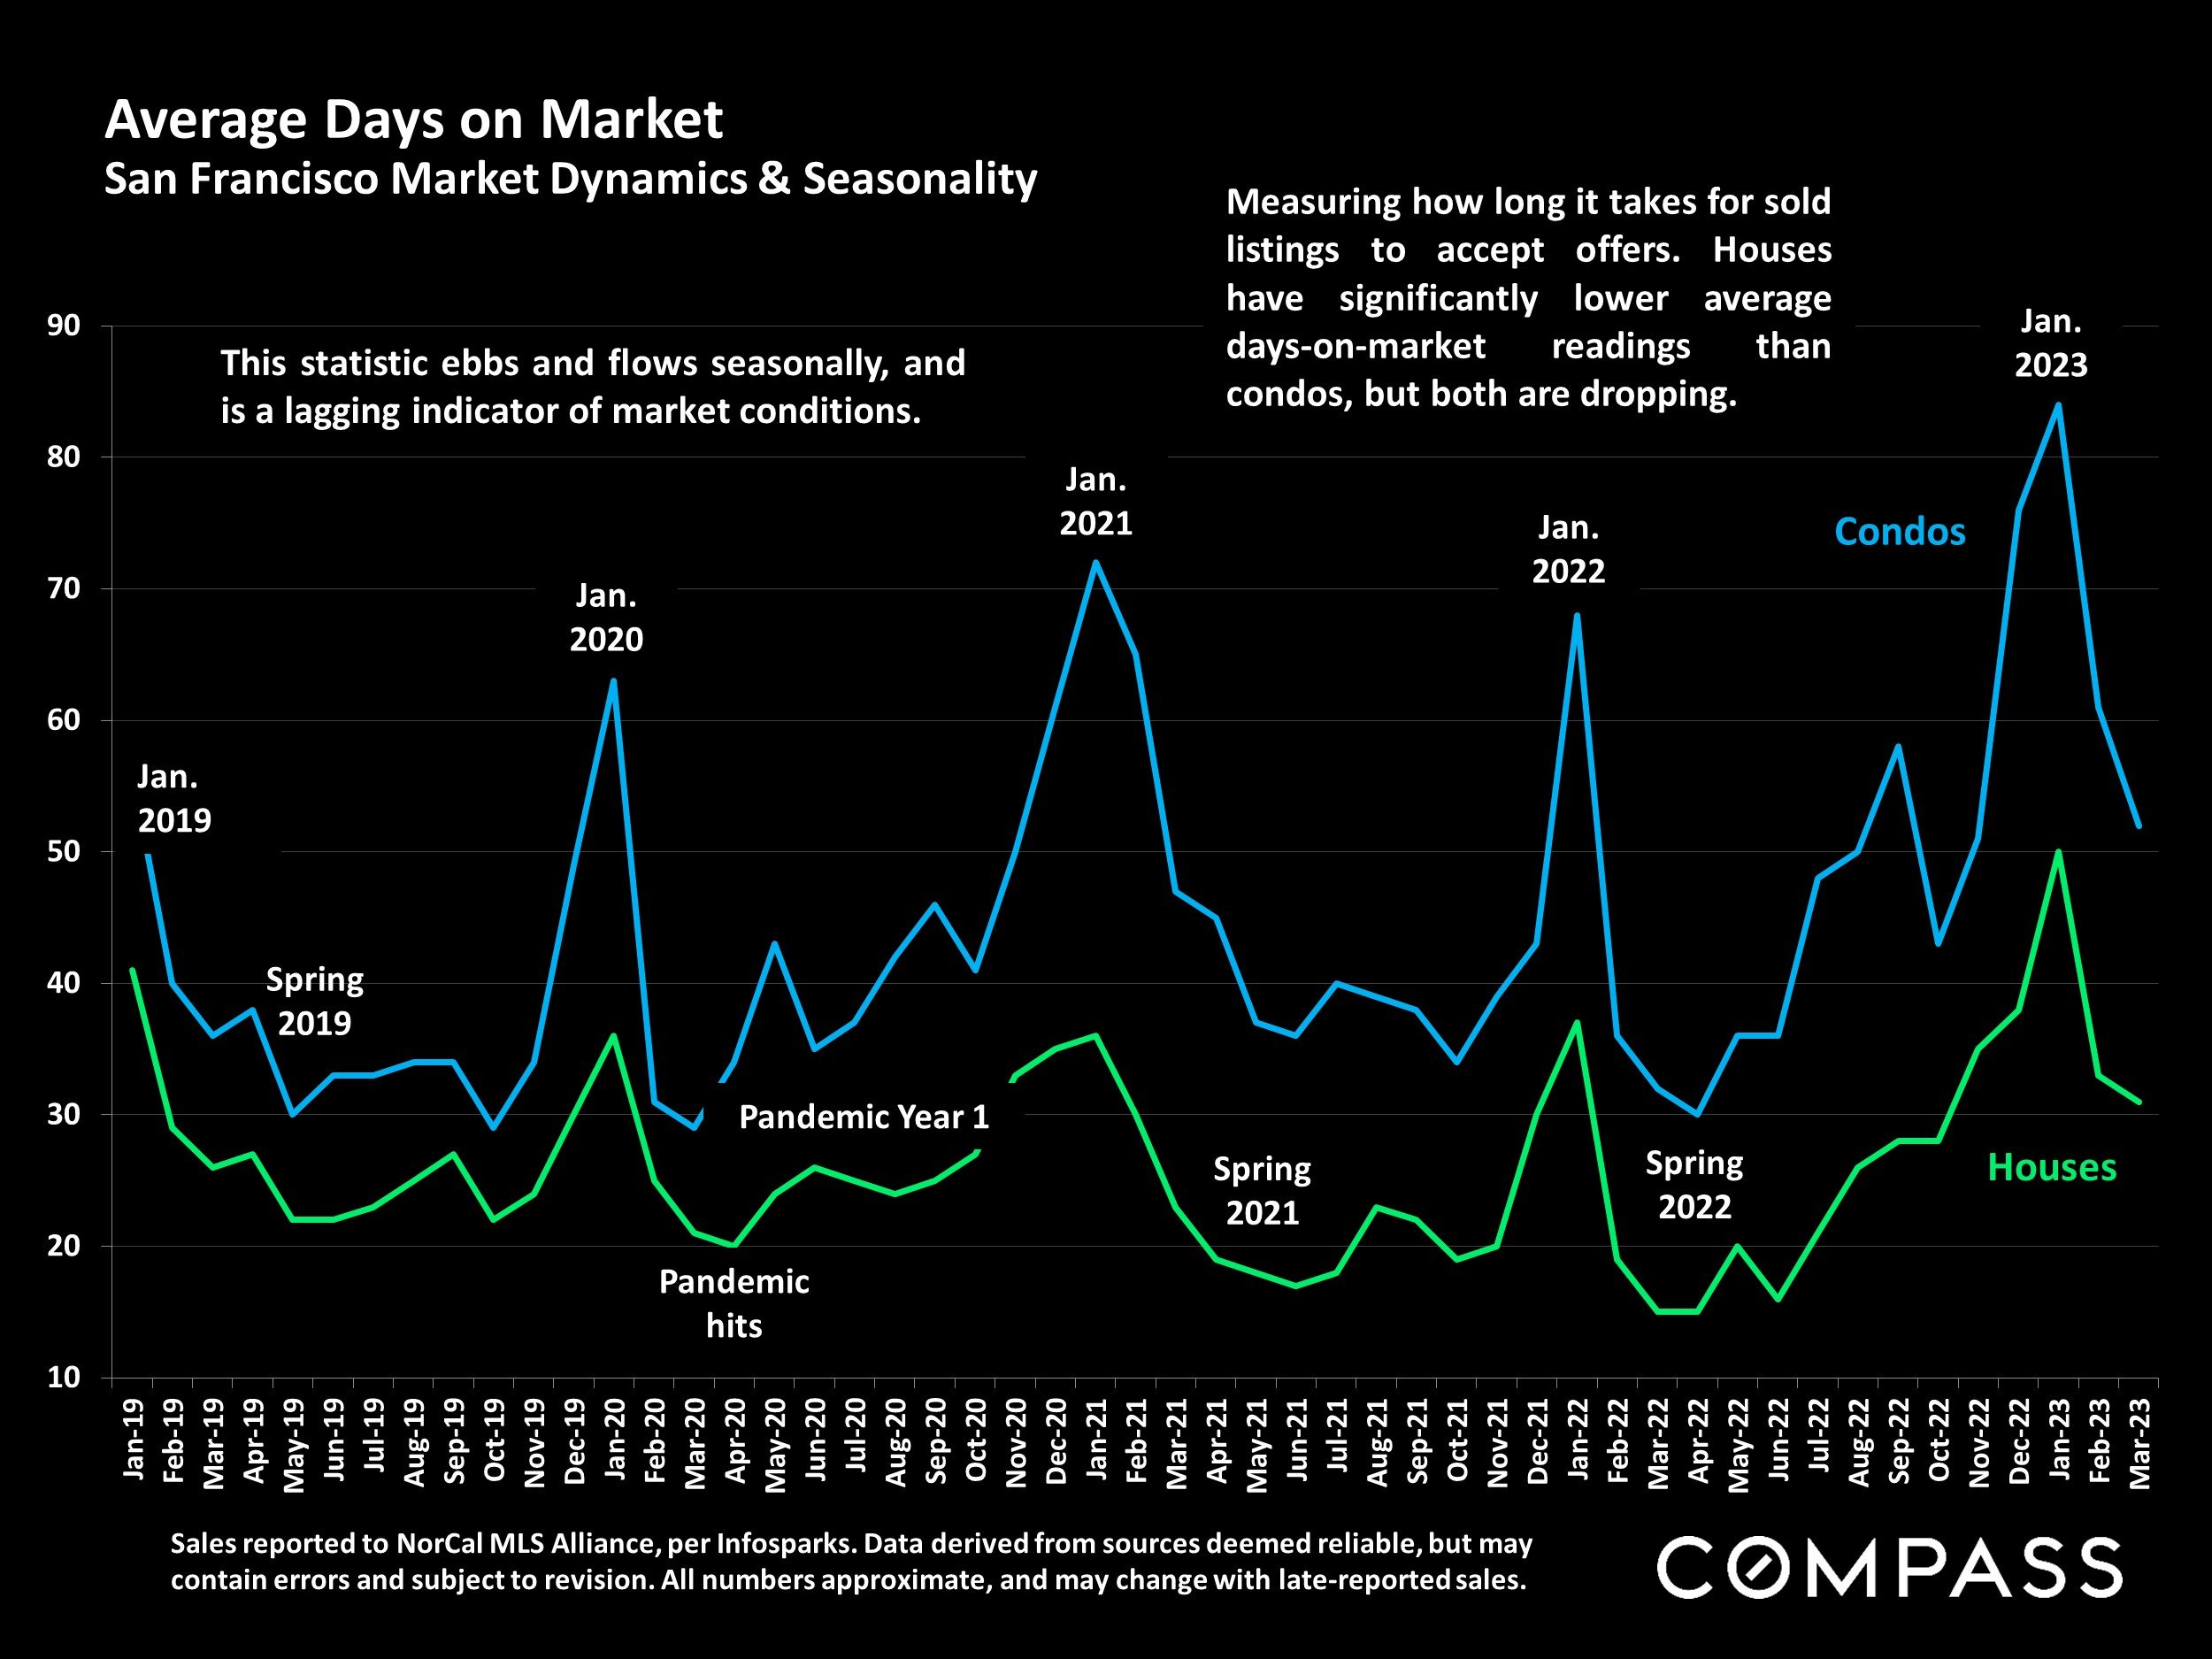
Although transactions are down, buyers are competing for good, well-priced properties. If you are willing to some work on a new home, deals are out there. As indicated by the chart below, the days on the market numbers are falling (which points to properties selling quickly).
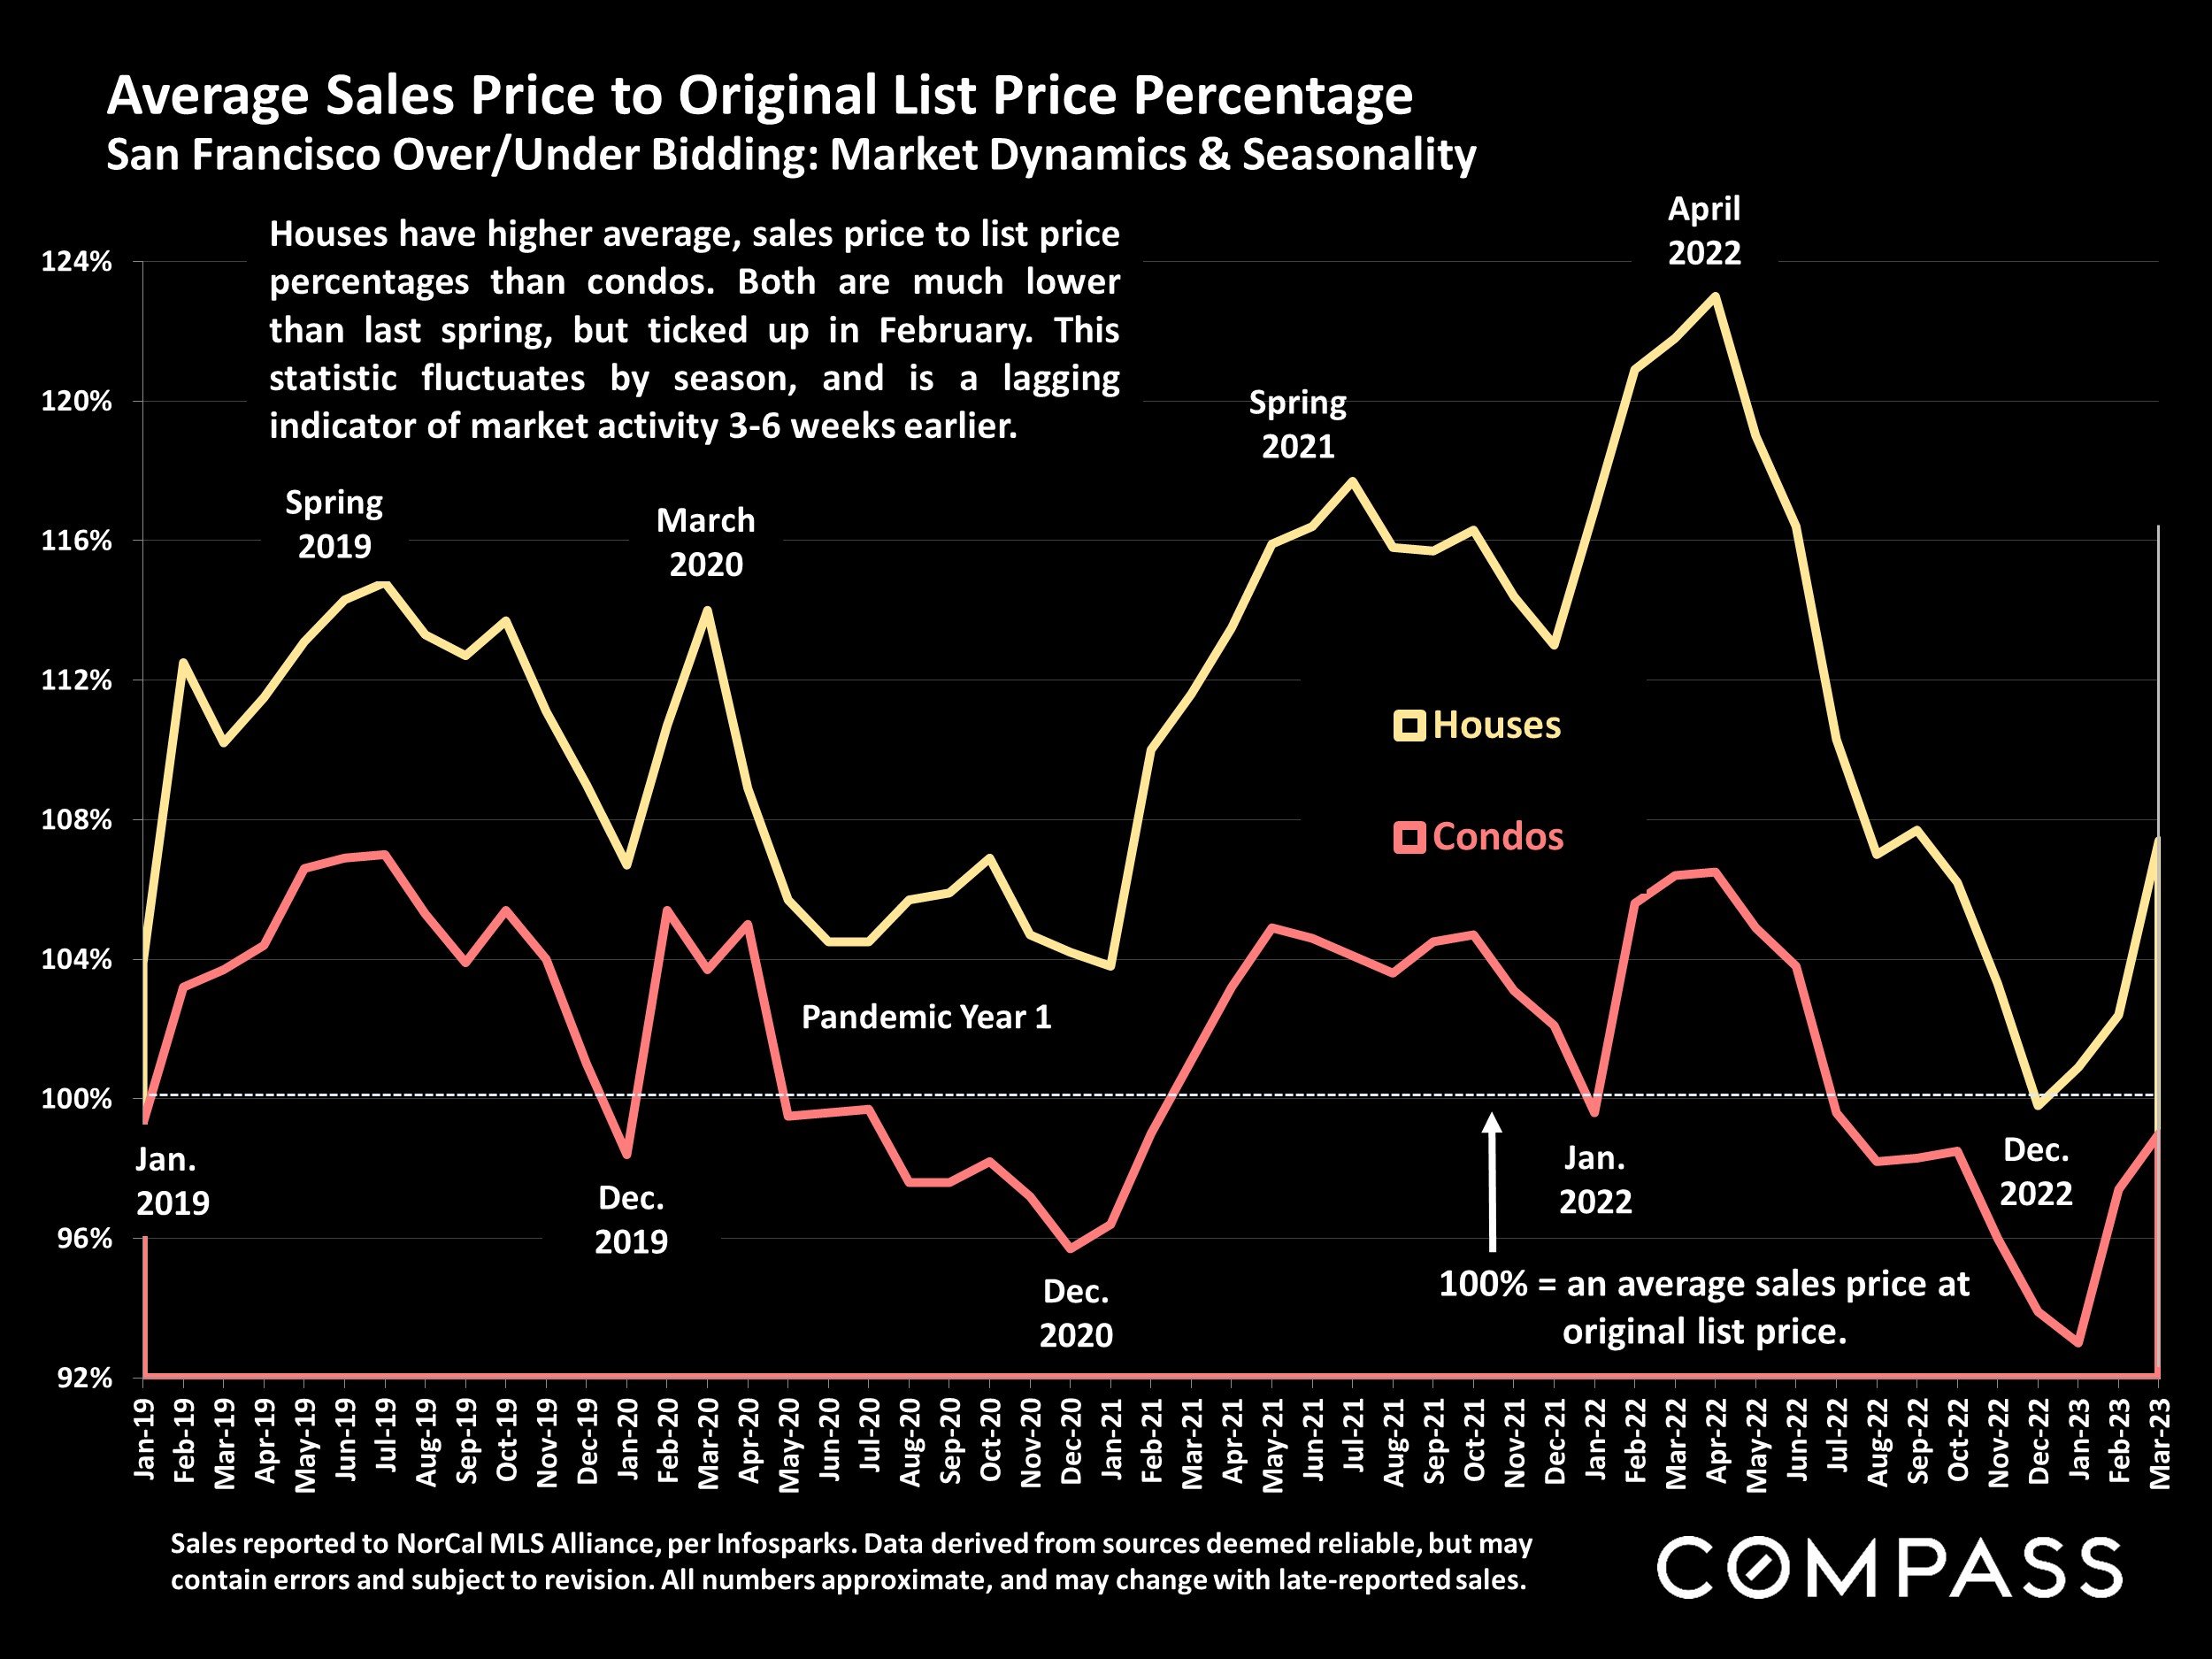
As far home selling for list price (or above or below), the trend of overbid is moving up as indicated by the chart below.
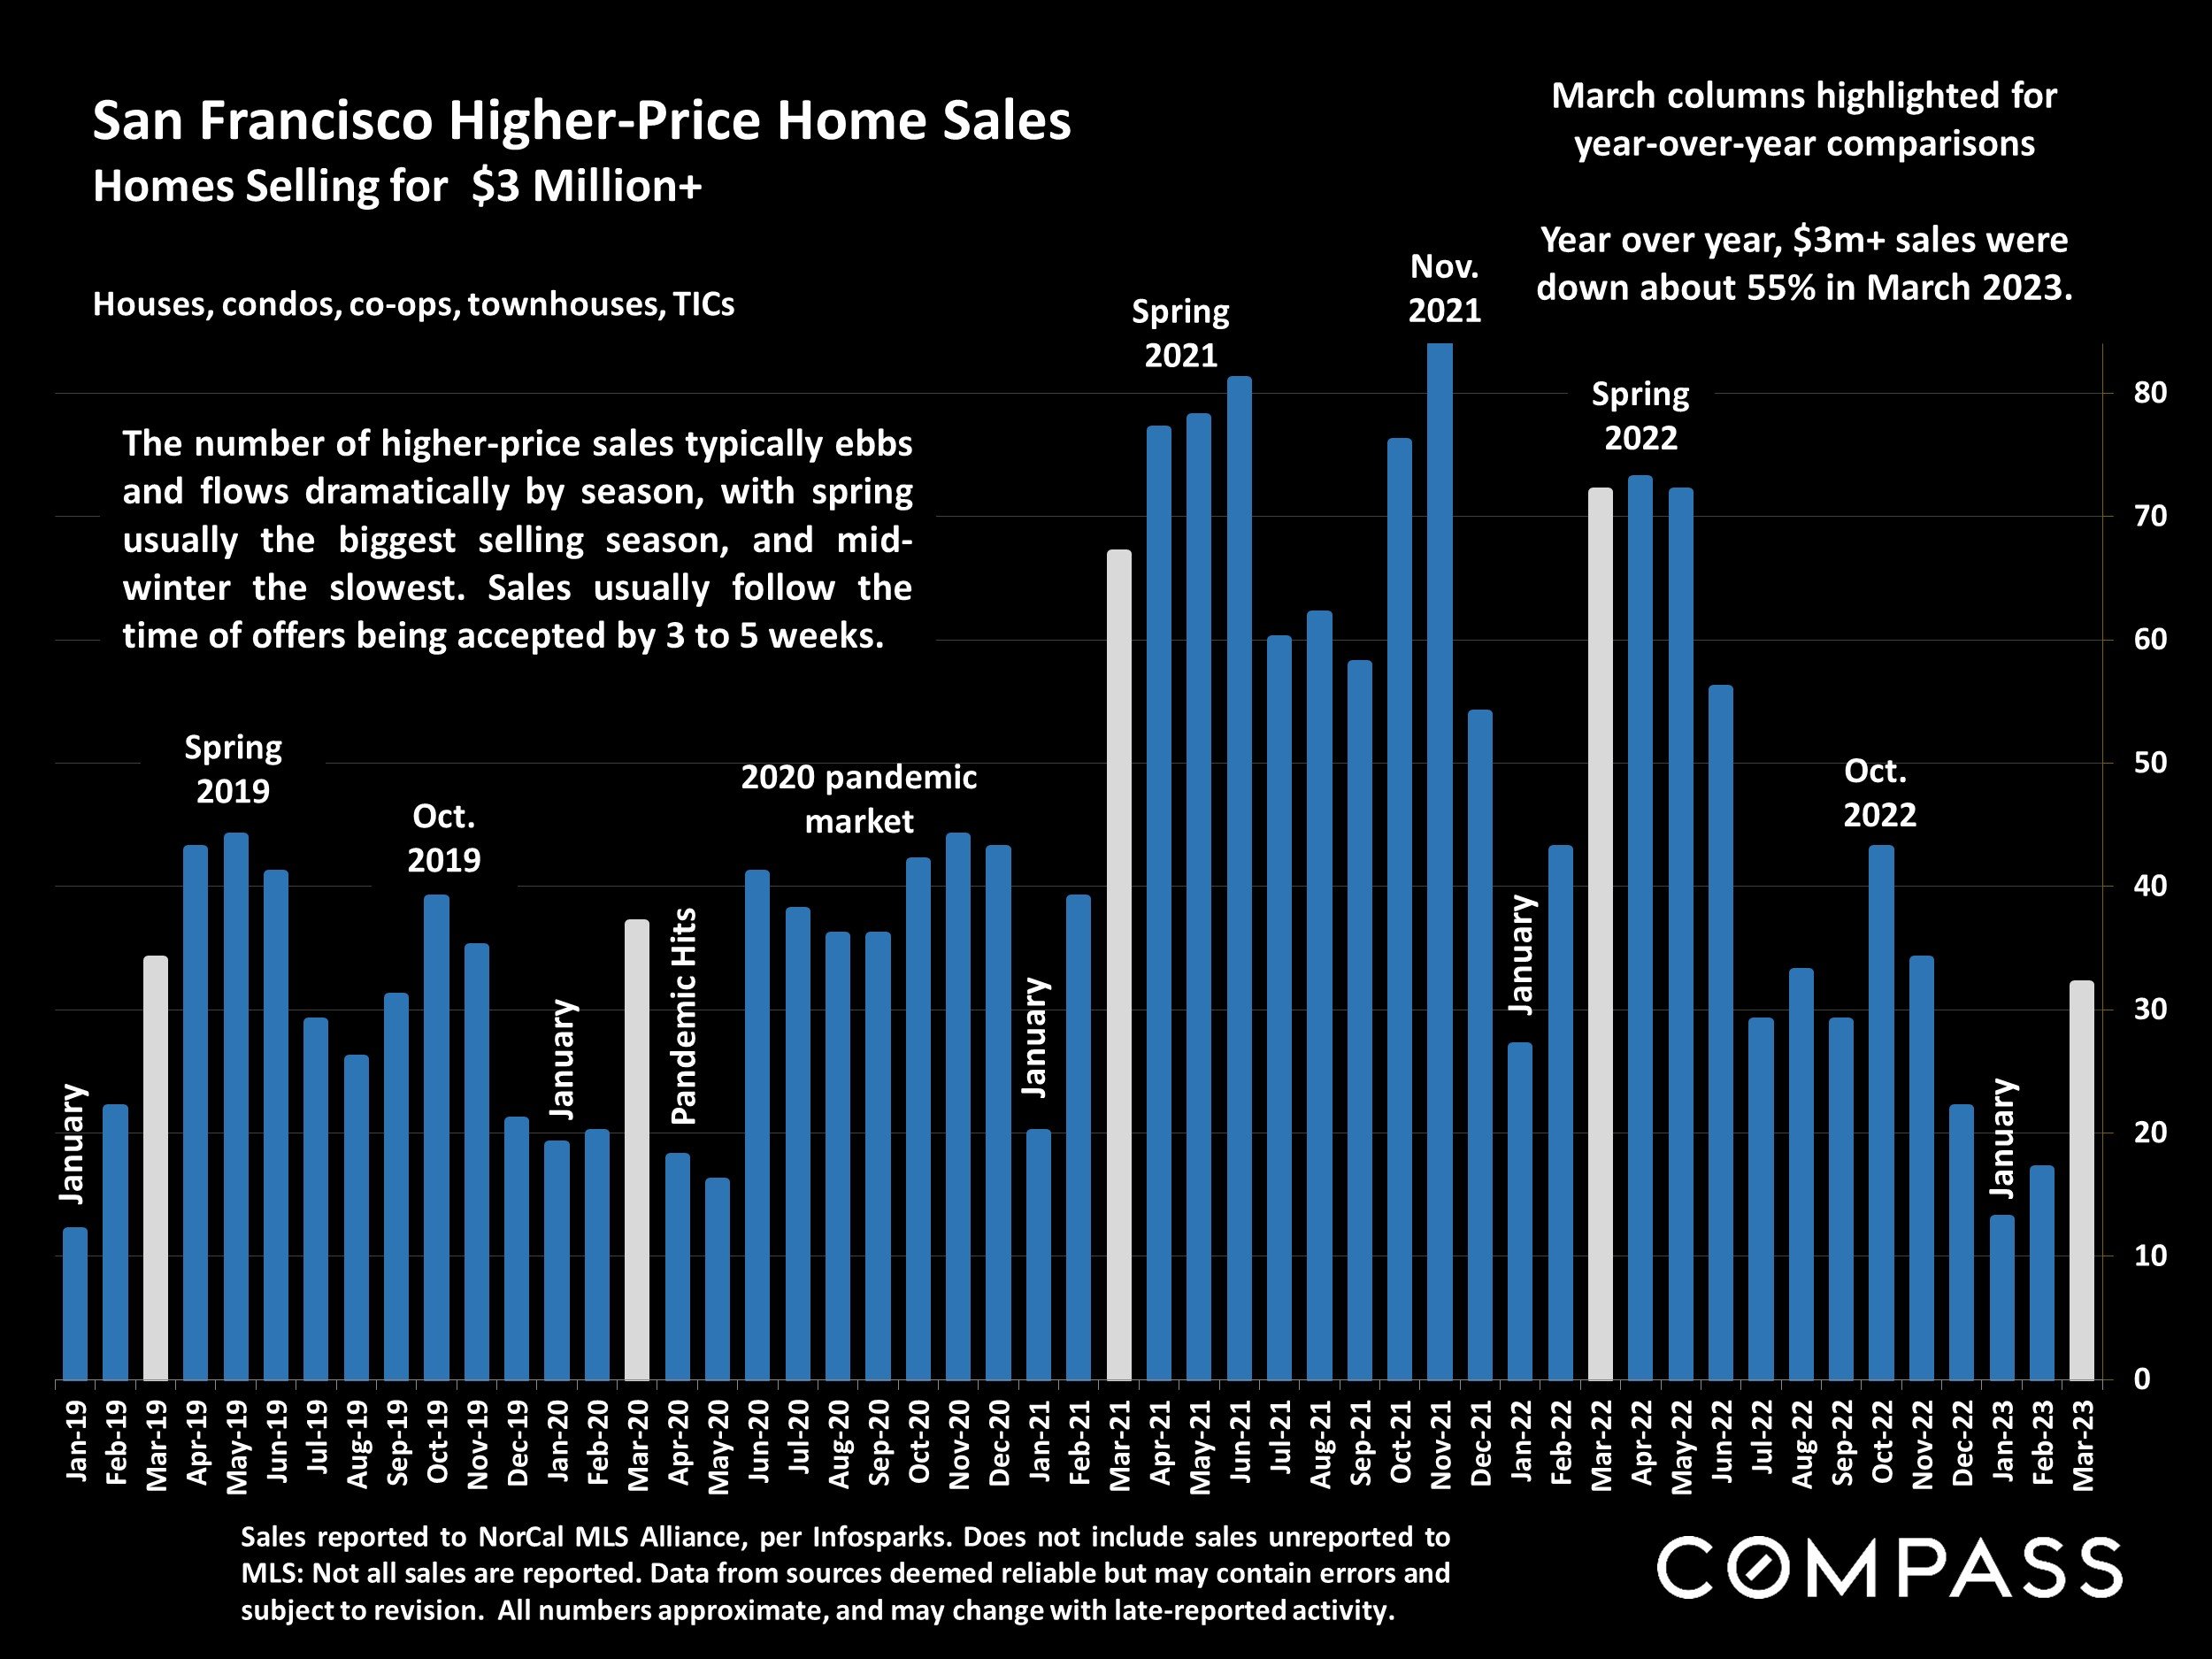
The higher priced home sales activity is also picking up again after a decline over the past few quarters.
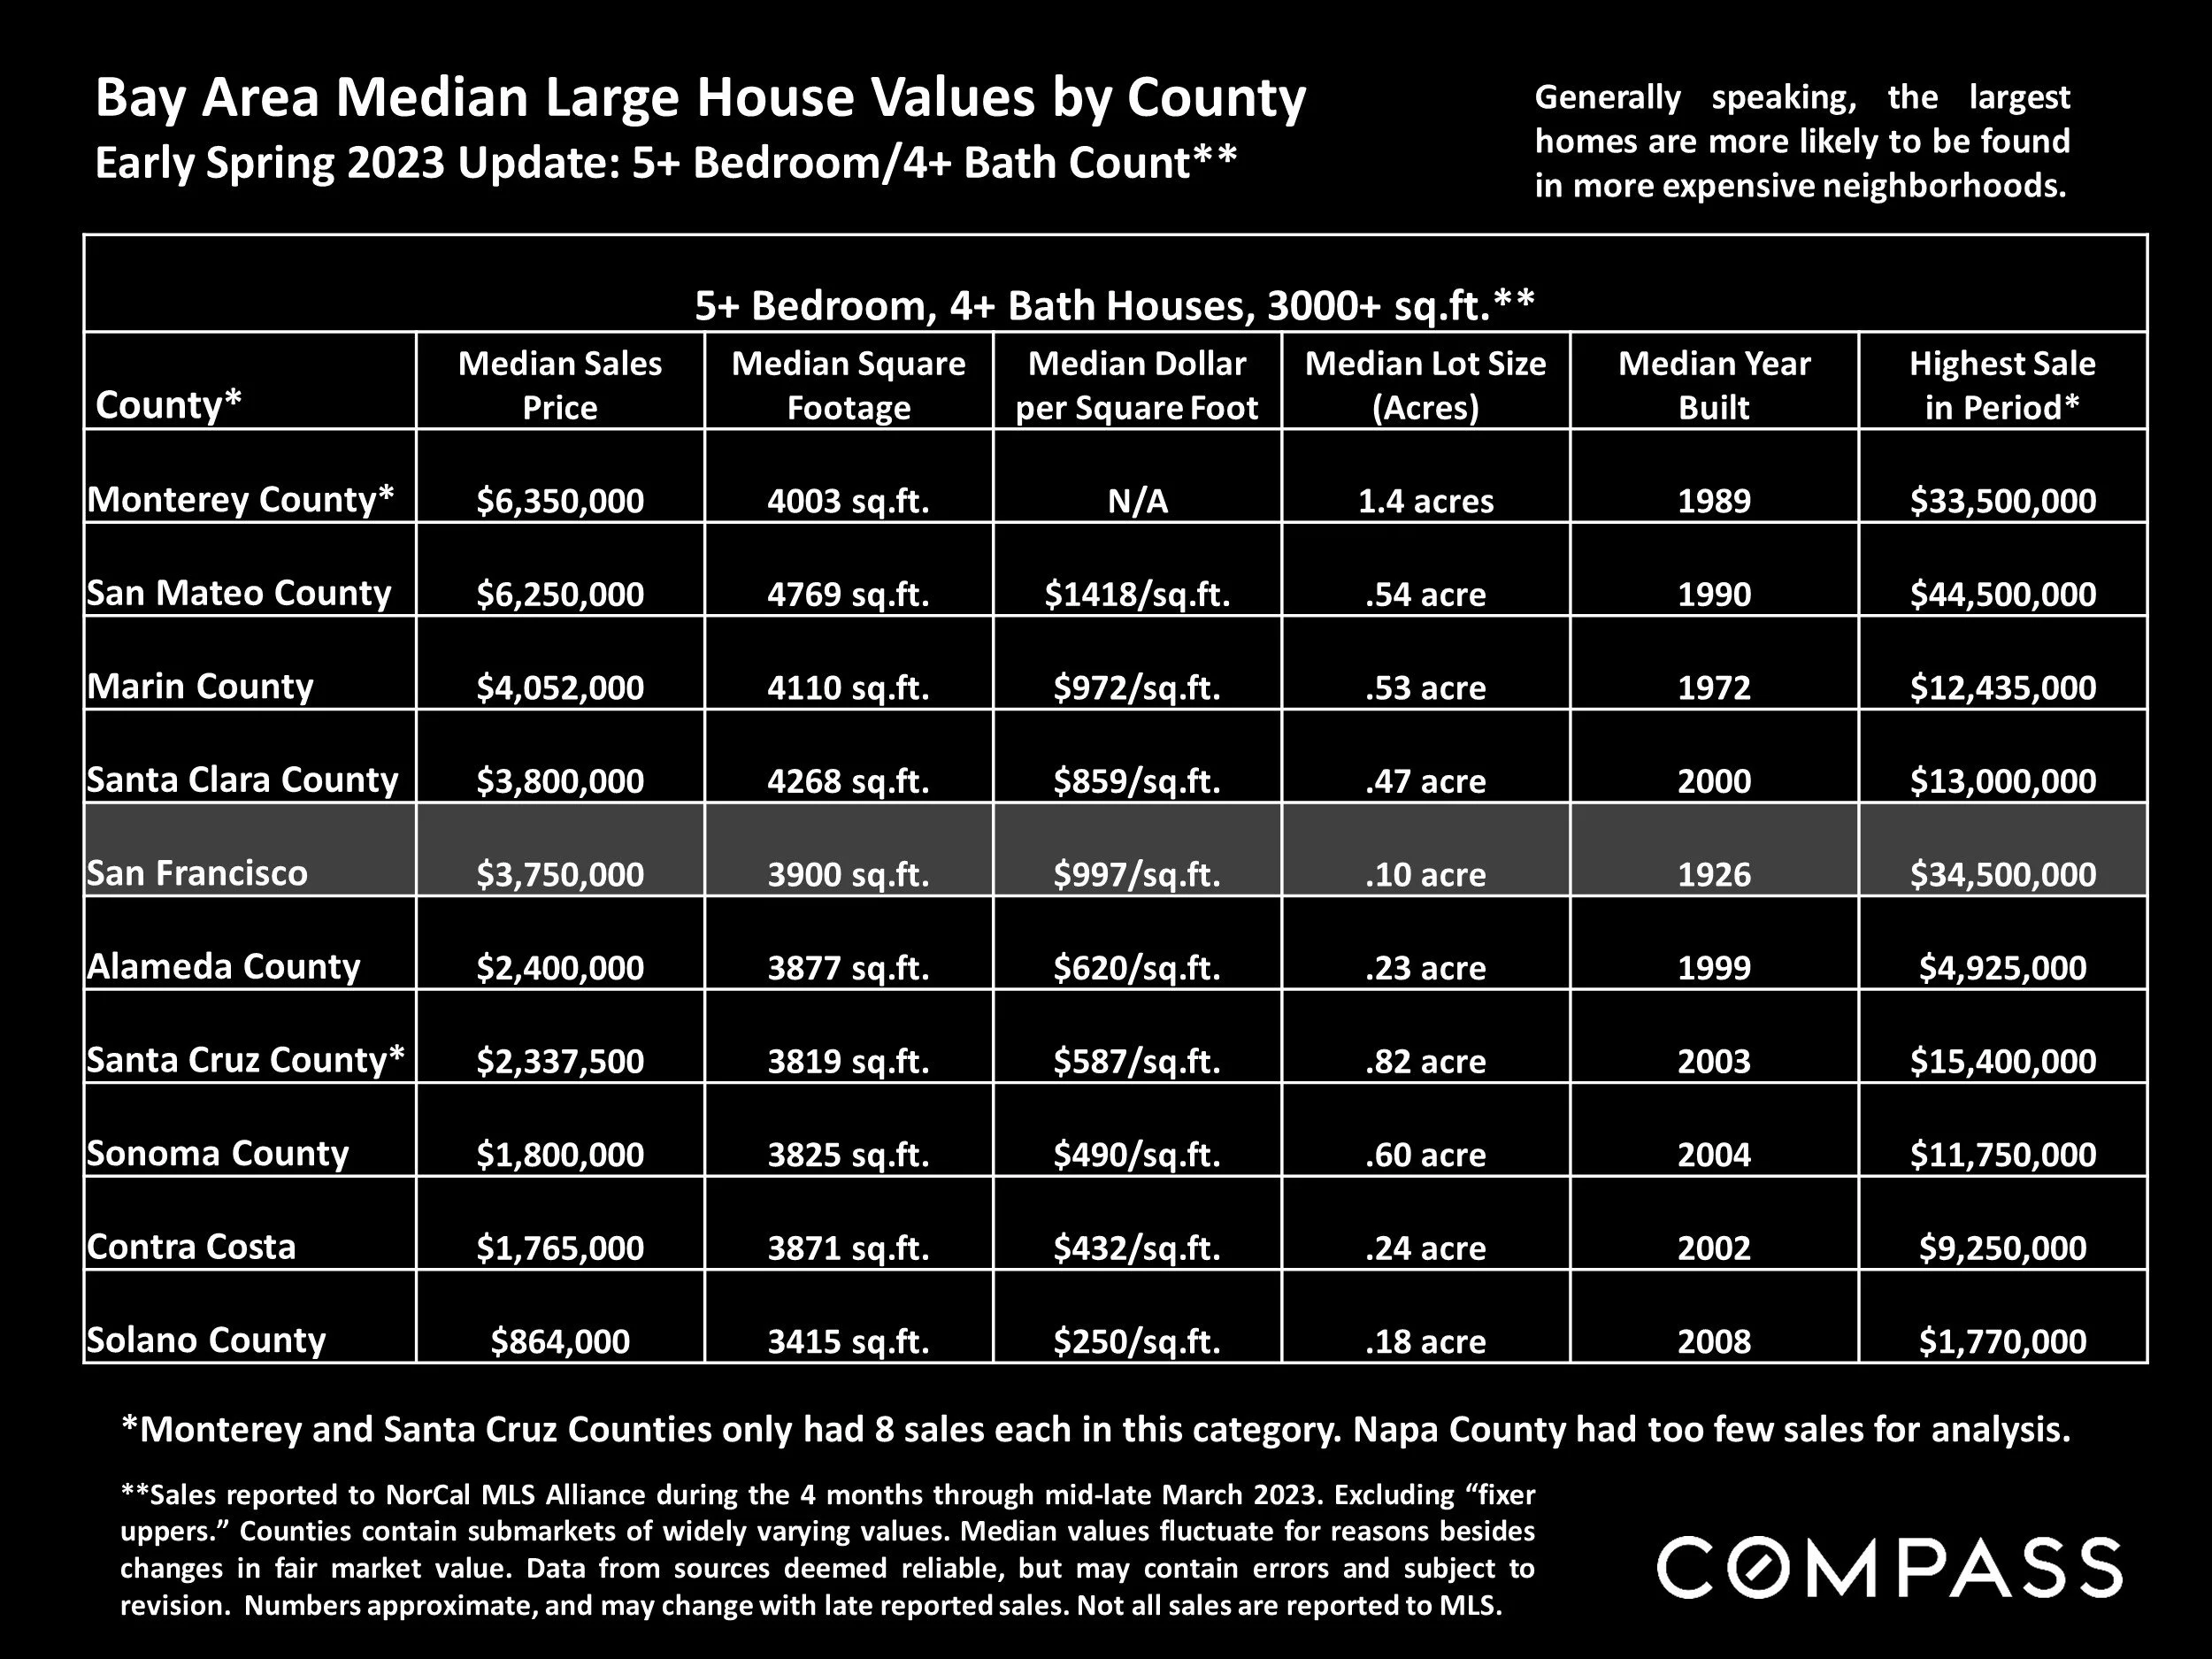
Thinking about buying in other Bay Area counties (or what properties cost in other counties)? The two charts below put perspective on like-sized homes and the cost.


