October 2022: San Francisco Real Estate Insider
Hello and I hope you are enjoying our great weather and local activities as of late. As the fall market is in full cycle we are seeing a big spike in inventory; due to seasonality as well as increased inventory via downward market pressure (interest rates, inflation, equity markets, etc.). With the increased inventory and depending on your preferred media outlet, there are many tales to the local market. Yes, inventory is up. Yes, sales are down. No, the market has not (and is not) crashed.
San Francisco is not a “one size fits all” market. Different market segments are performing and functioning on their separate trajectories. On the north side of town (the greater Richmond and Pacific Heights) single family homes under $2M are selling well. If they are in move-in condition, they are getting multiple offers. For reference, last quarter there were 19 sales with a median of 18 days on the market. As of this writing, there are 15 homes available and the median days on market is seven. The deduction is that entry level homes are selling quickly.
The $2M - $5M segment as well as the $5M - $10M segment are seeing the most opportunistic buyers as the inventory counts are definitely up. The best homes in these categories are going quickly with multiple offers. In the $2M - $5M segment we had 33 sales with a median of 12 days on the market (last quarter). Currently, we have 23 available properties with a median of 22 days on the market.
The $10M+ segment is down. Citywide, we have seen nine sales over $10M (YTD) vs. 16 in the same time period last year. Top end buyers are truly measuring what they get in San Francisco vs. A+ Peninsula, Marin and out of area locales. Sadly, many buyers on the top end are finding more of their current housing / lifestyle / family needs met elsewhere.
Interest rates are now north of six percent (approx. double what they were in January) and another rate increase is expected by year-end. Buyers are obviously experiencing a large decrease in purchasing power. For example, if you are buying a $4M house and borrowing 80% of the purchase price ($3.2M), your January era payment would have been $13,491/mo. vs. $19,186/mo. today. Not trivial!
Some of the decrease in purchasing power is real; some not so much. Depending on a buyers preferred neighborhood, I am seeing some buyers get their offer ratified at approx. 10% - 15% below spring era pricing. Additionally, for buyers trading up into larger properties, they are often selling for less (than March pricing), but they are also buying at a lower price (and getting a lower tax base). That, in and of itself, is a win.
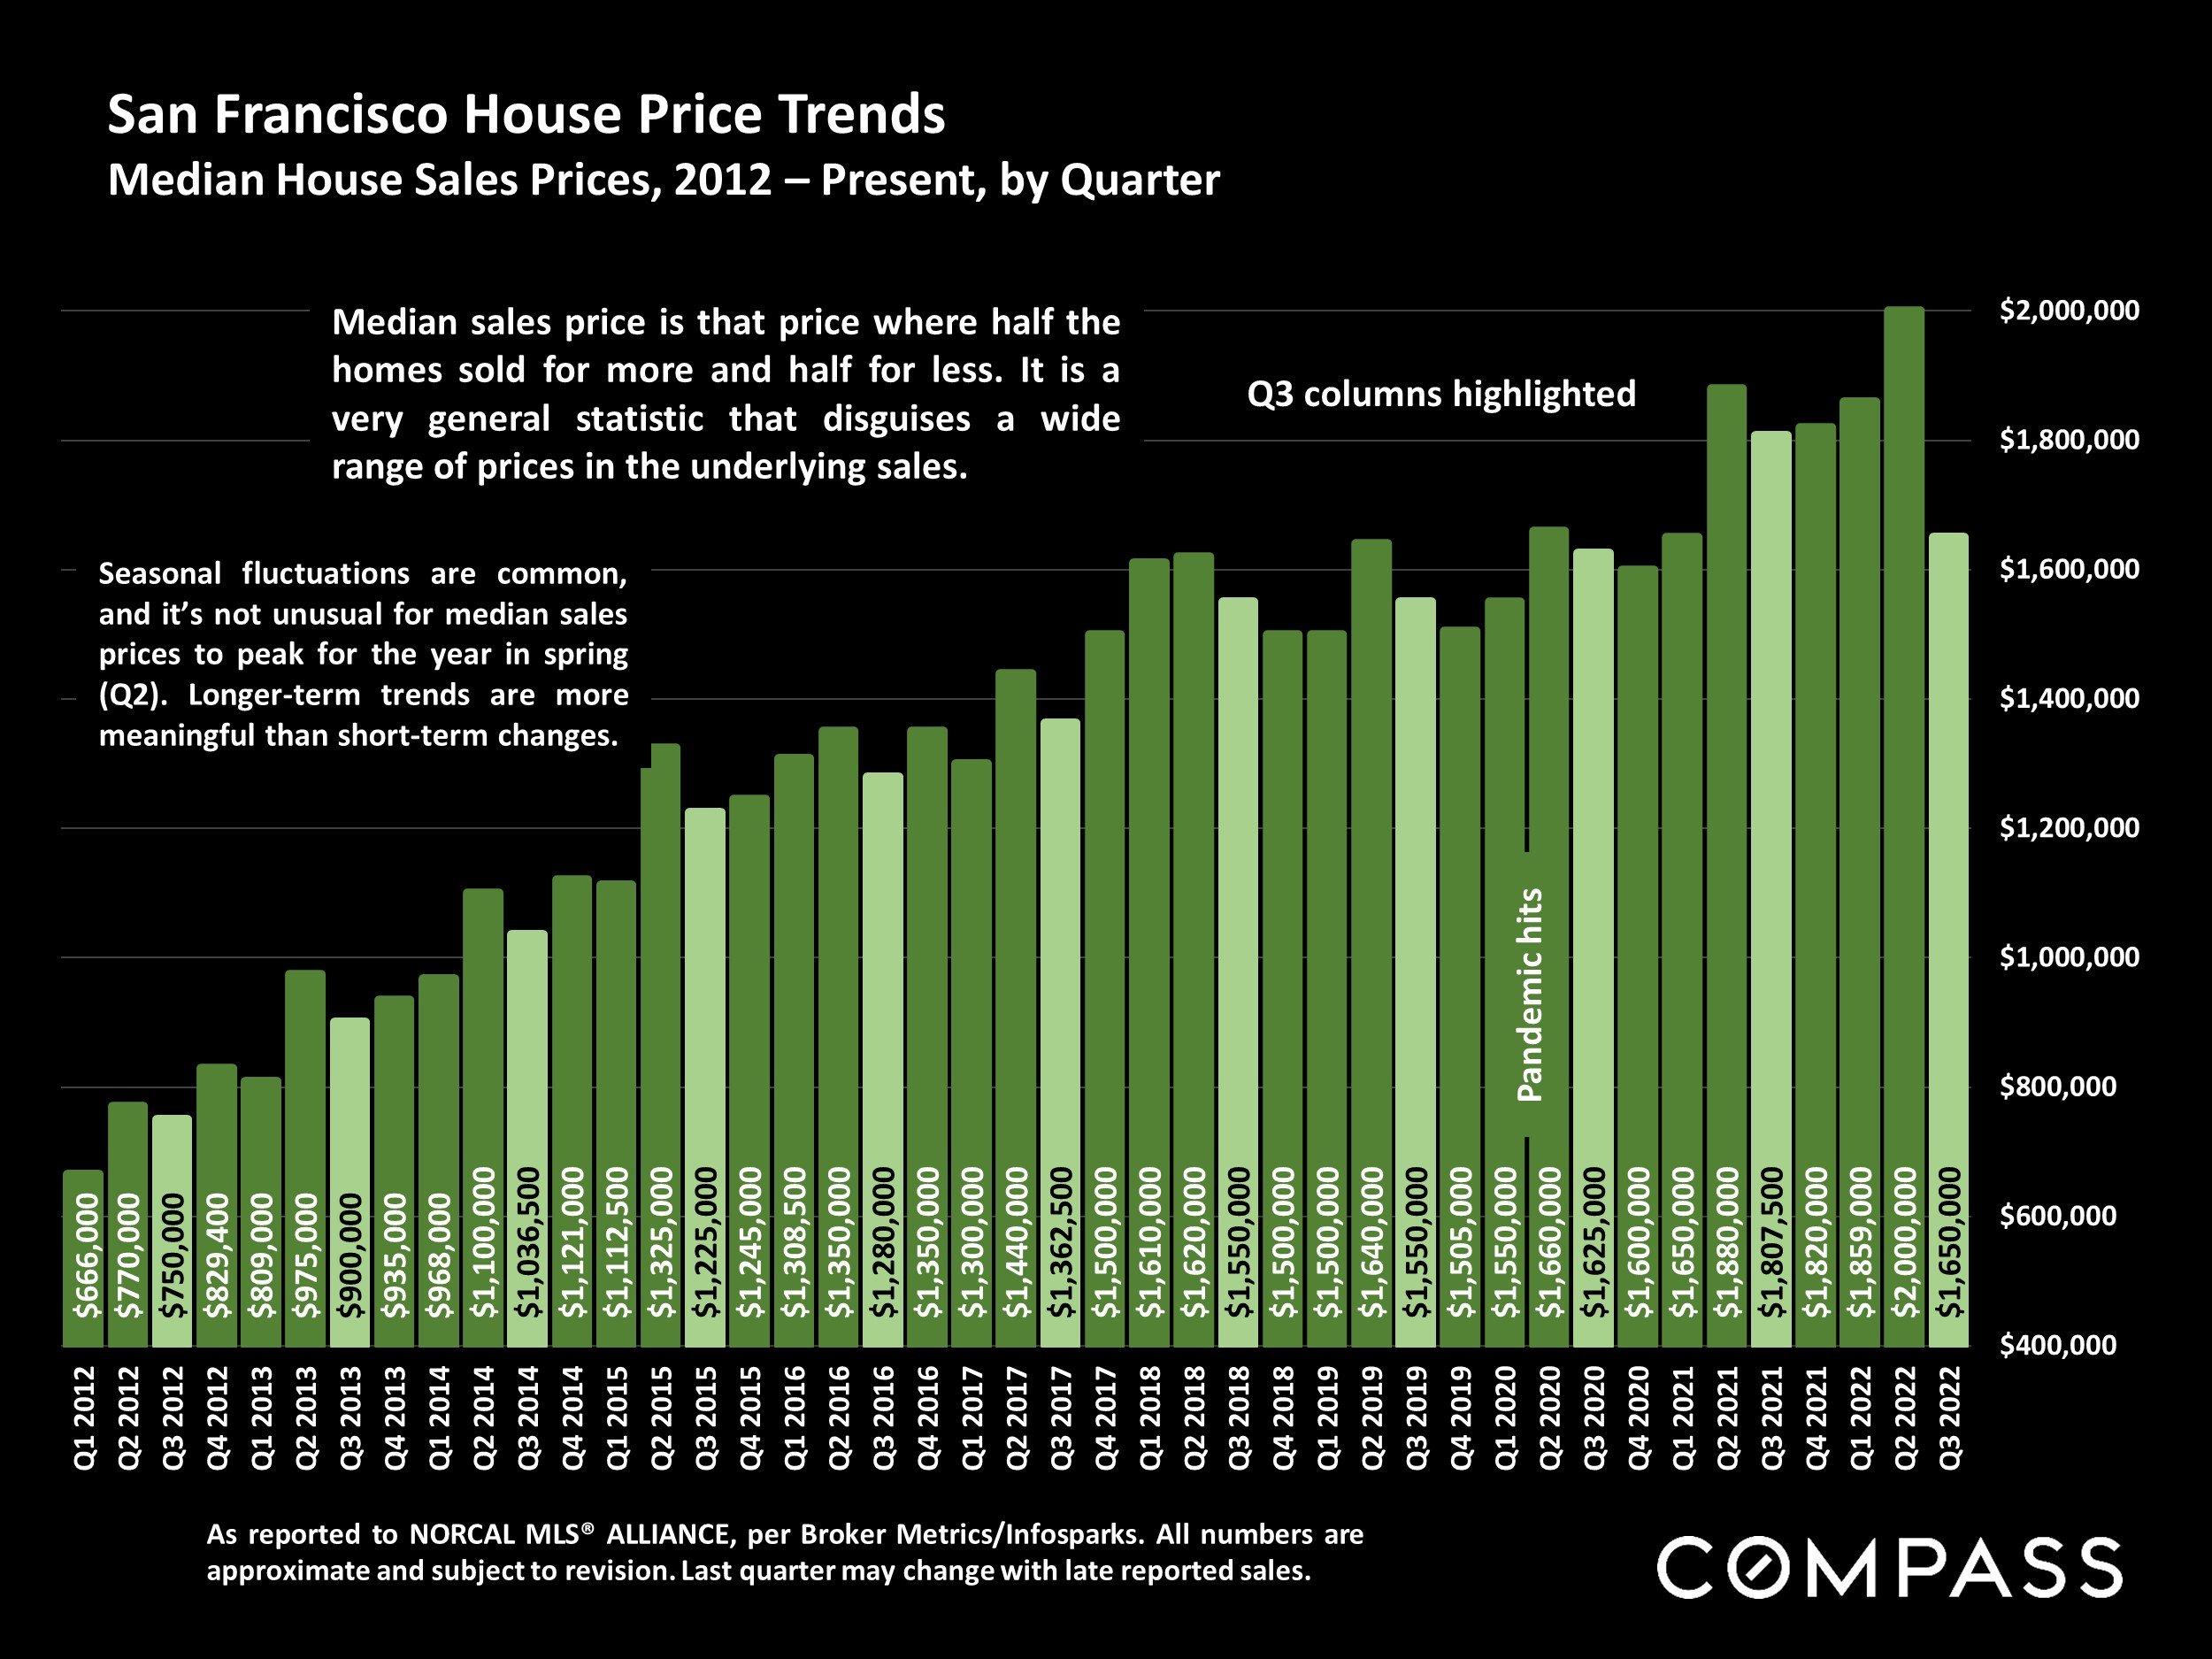
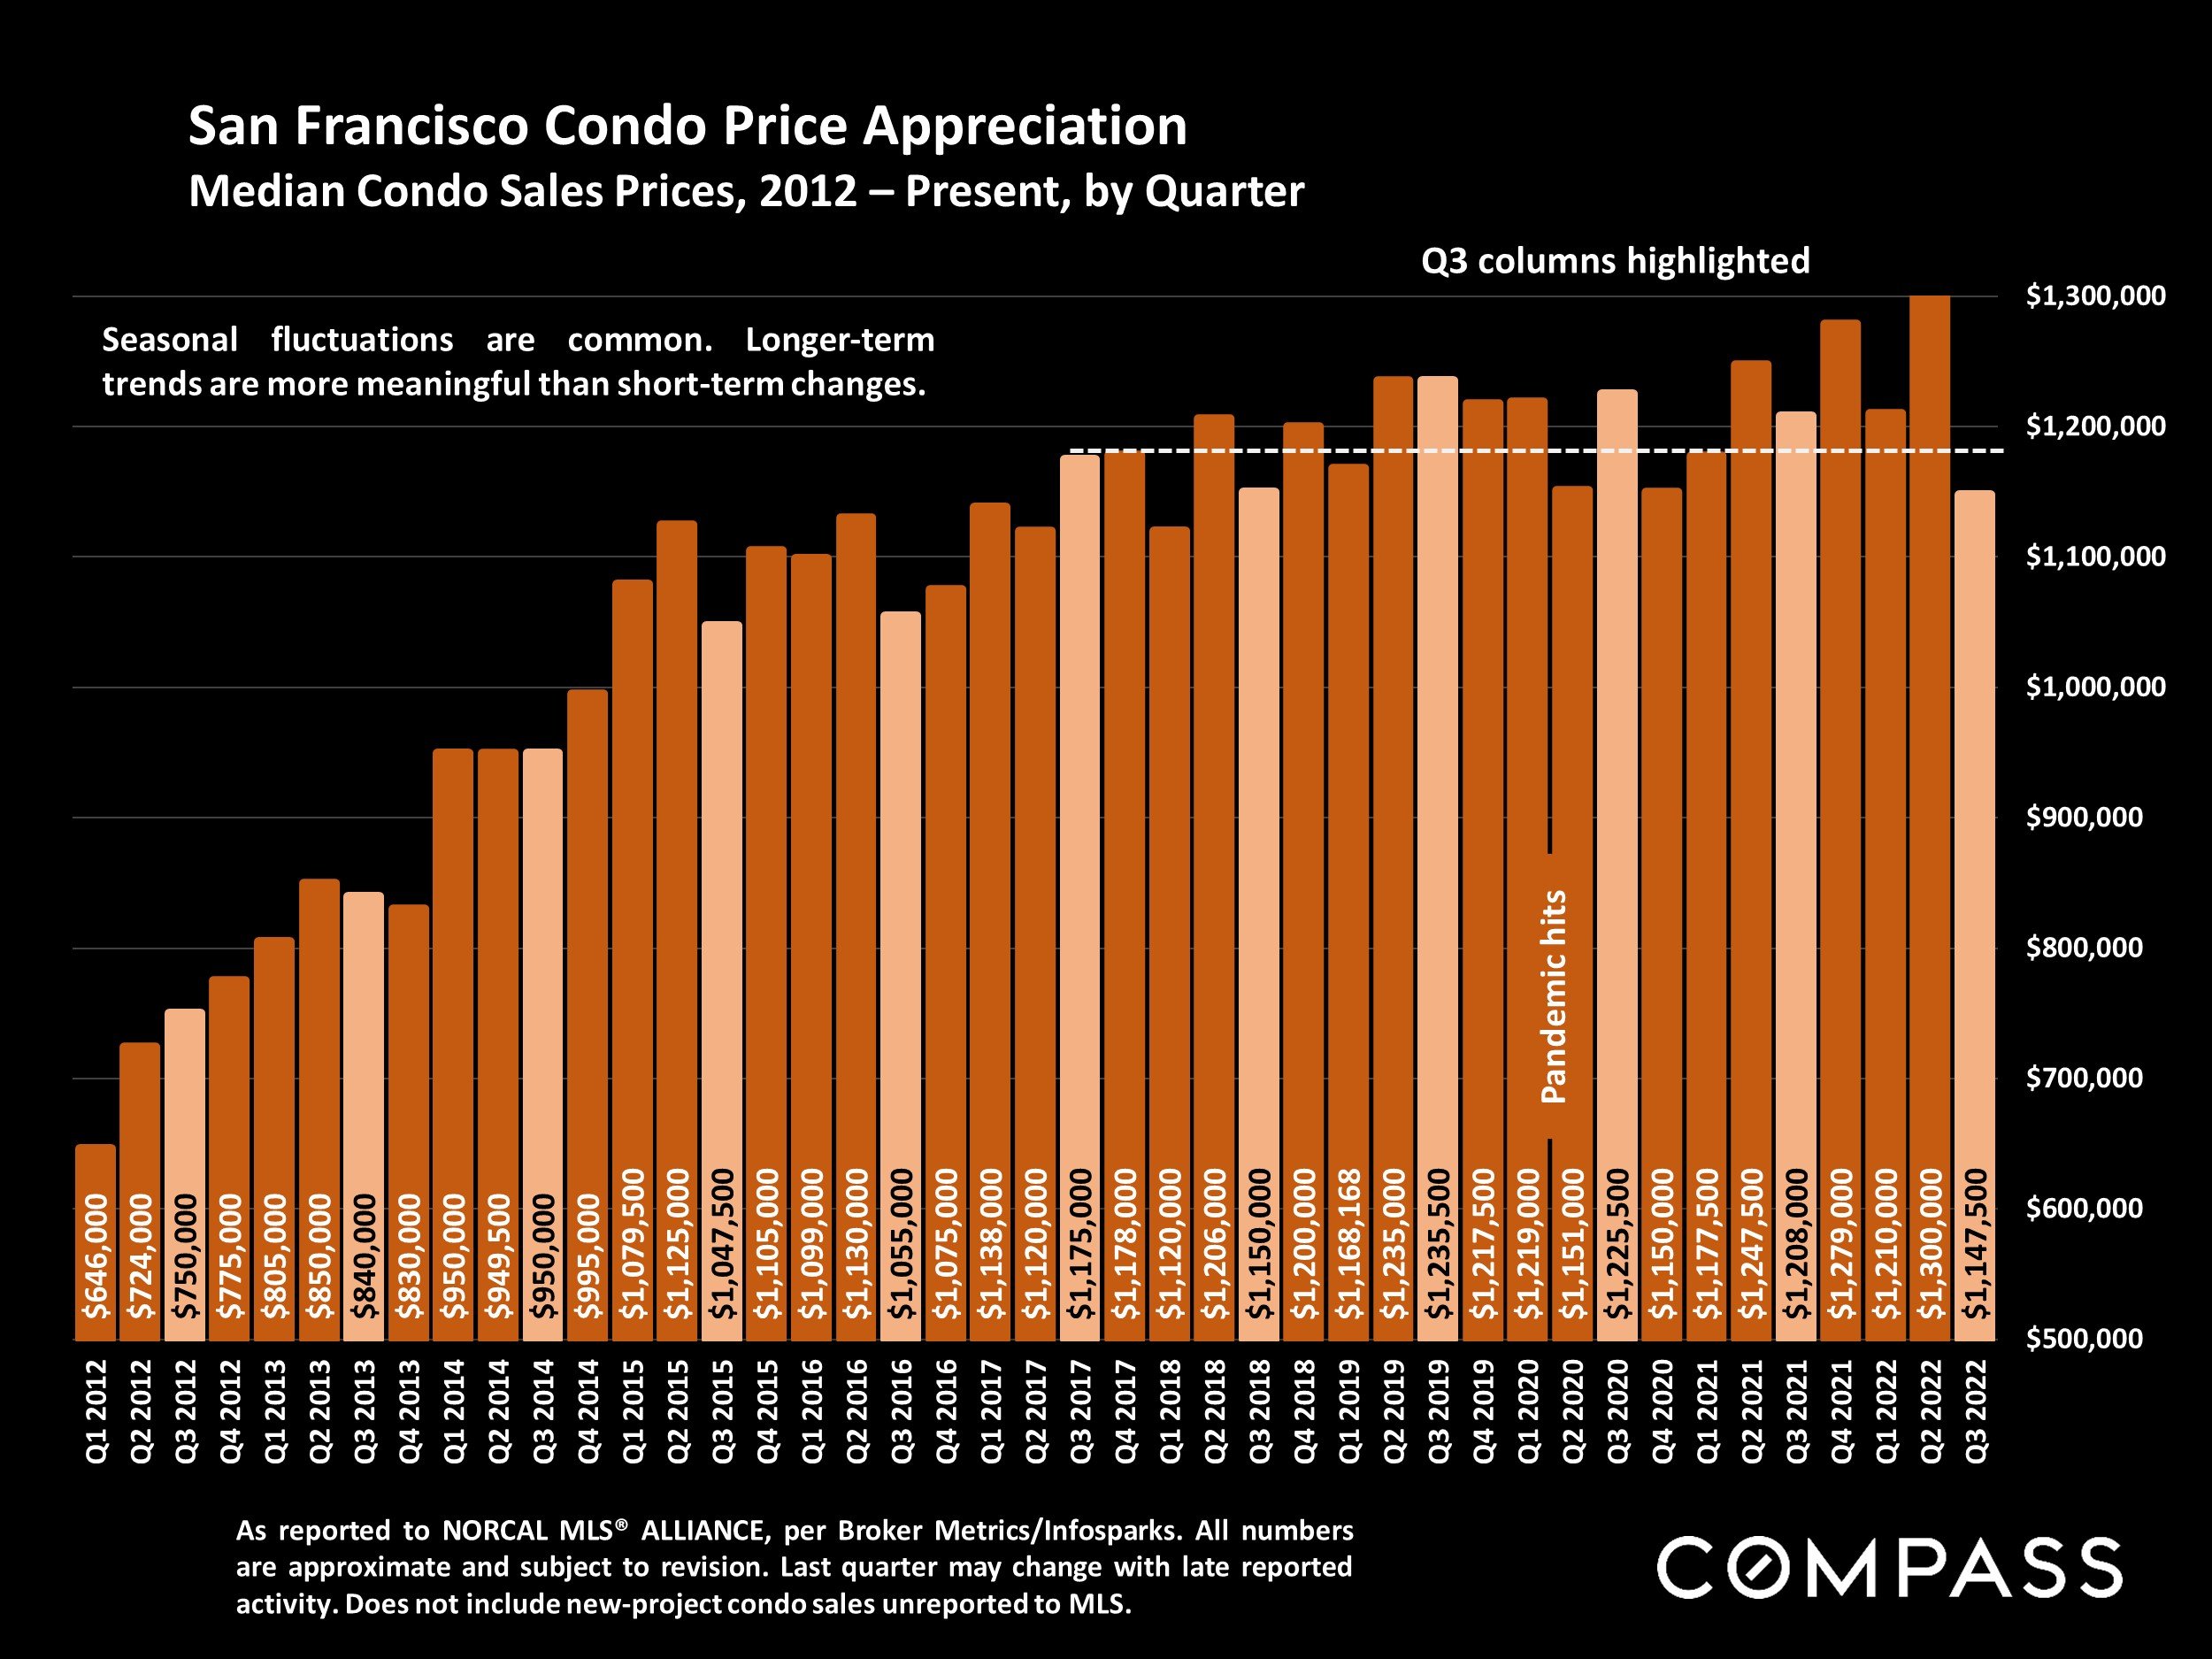
On to some interesting data points for October. The Q3 home and condo markets trended downward in terms of pricing.
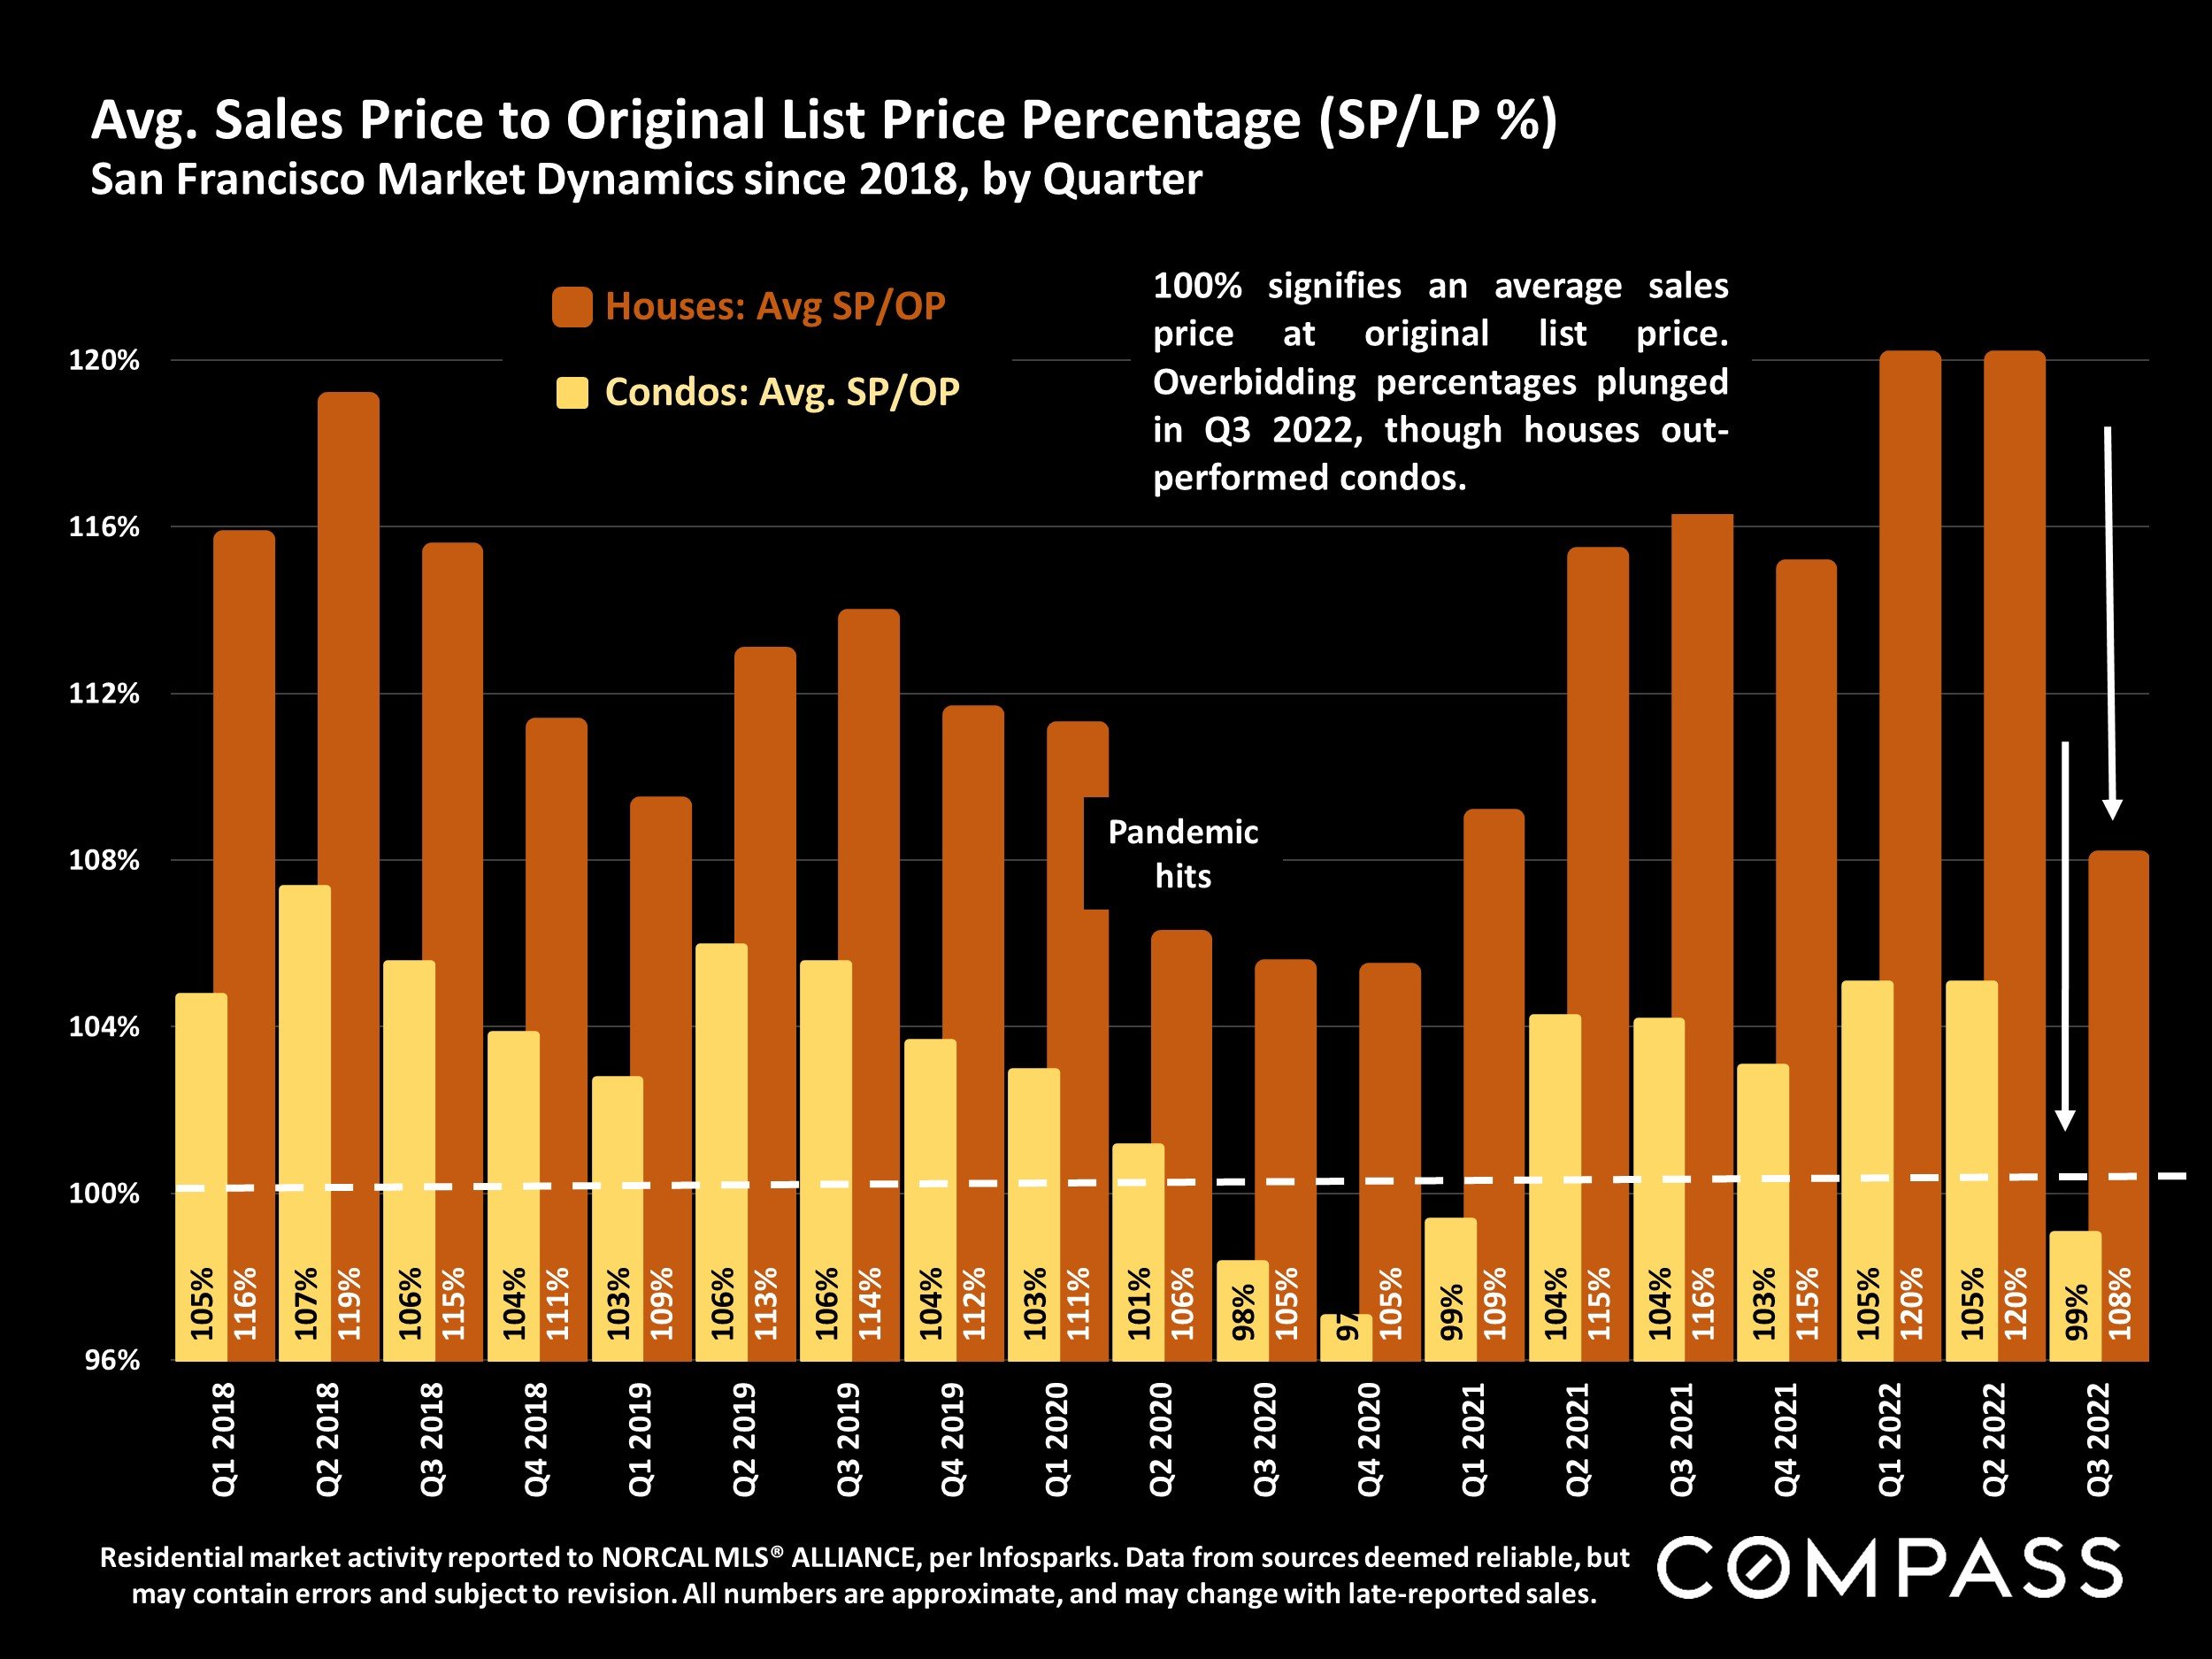
A strong indicator of demand is the final sale to list price. This is the actual selling price vs. the listing price. This is obviously influenced by underpricing, but that (pricing) strategy is not very smart in the current market environment.
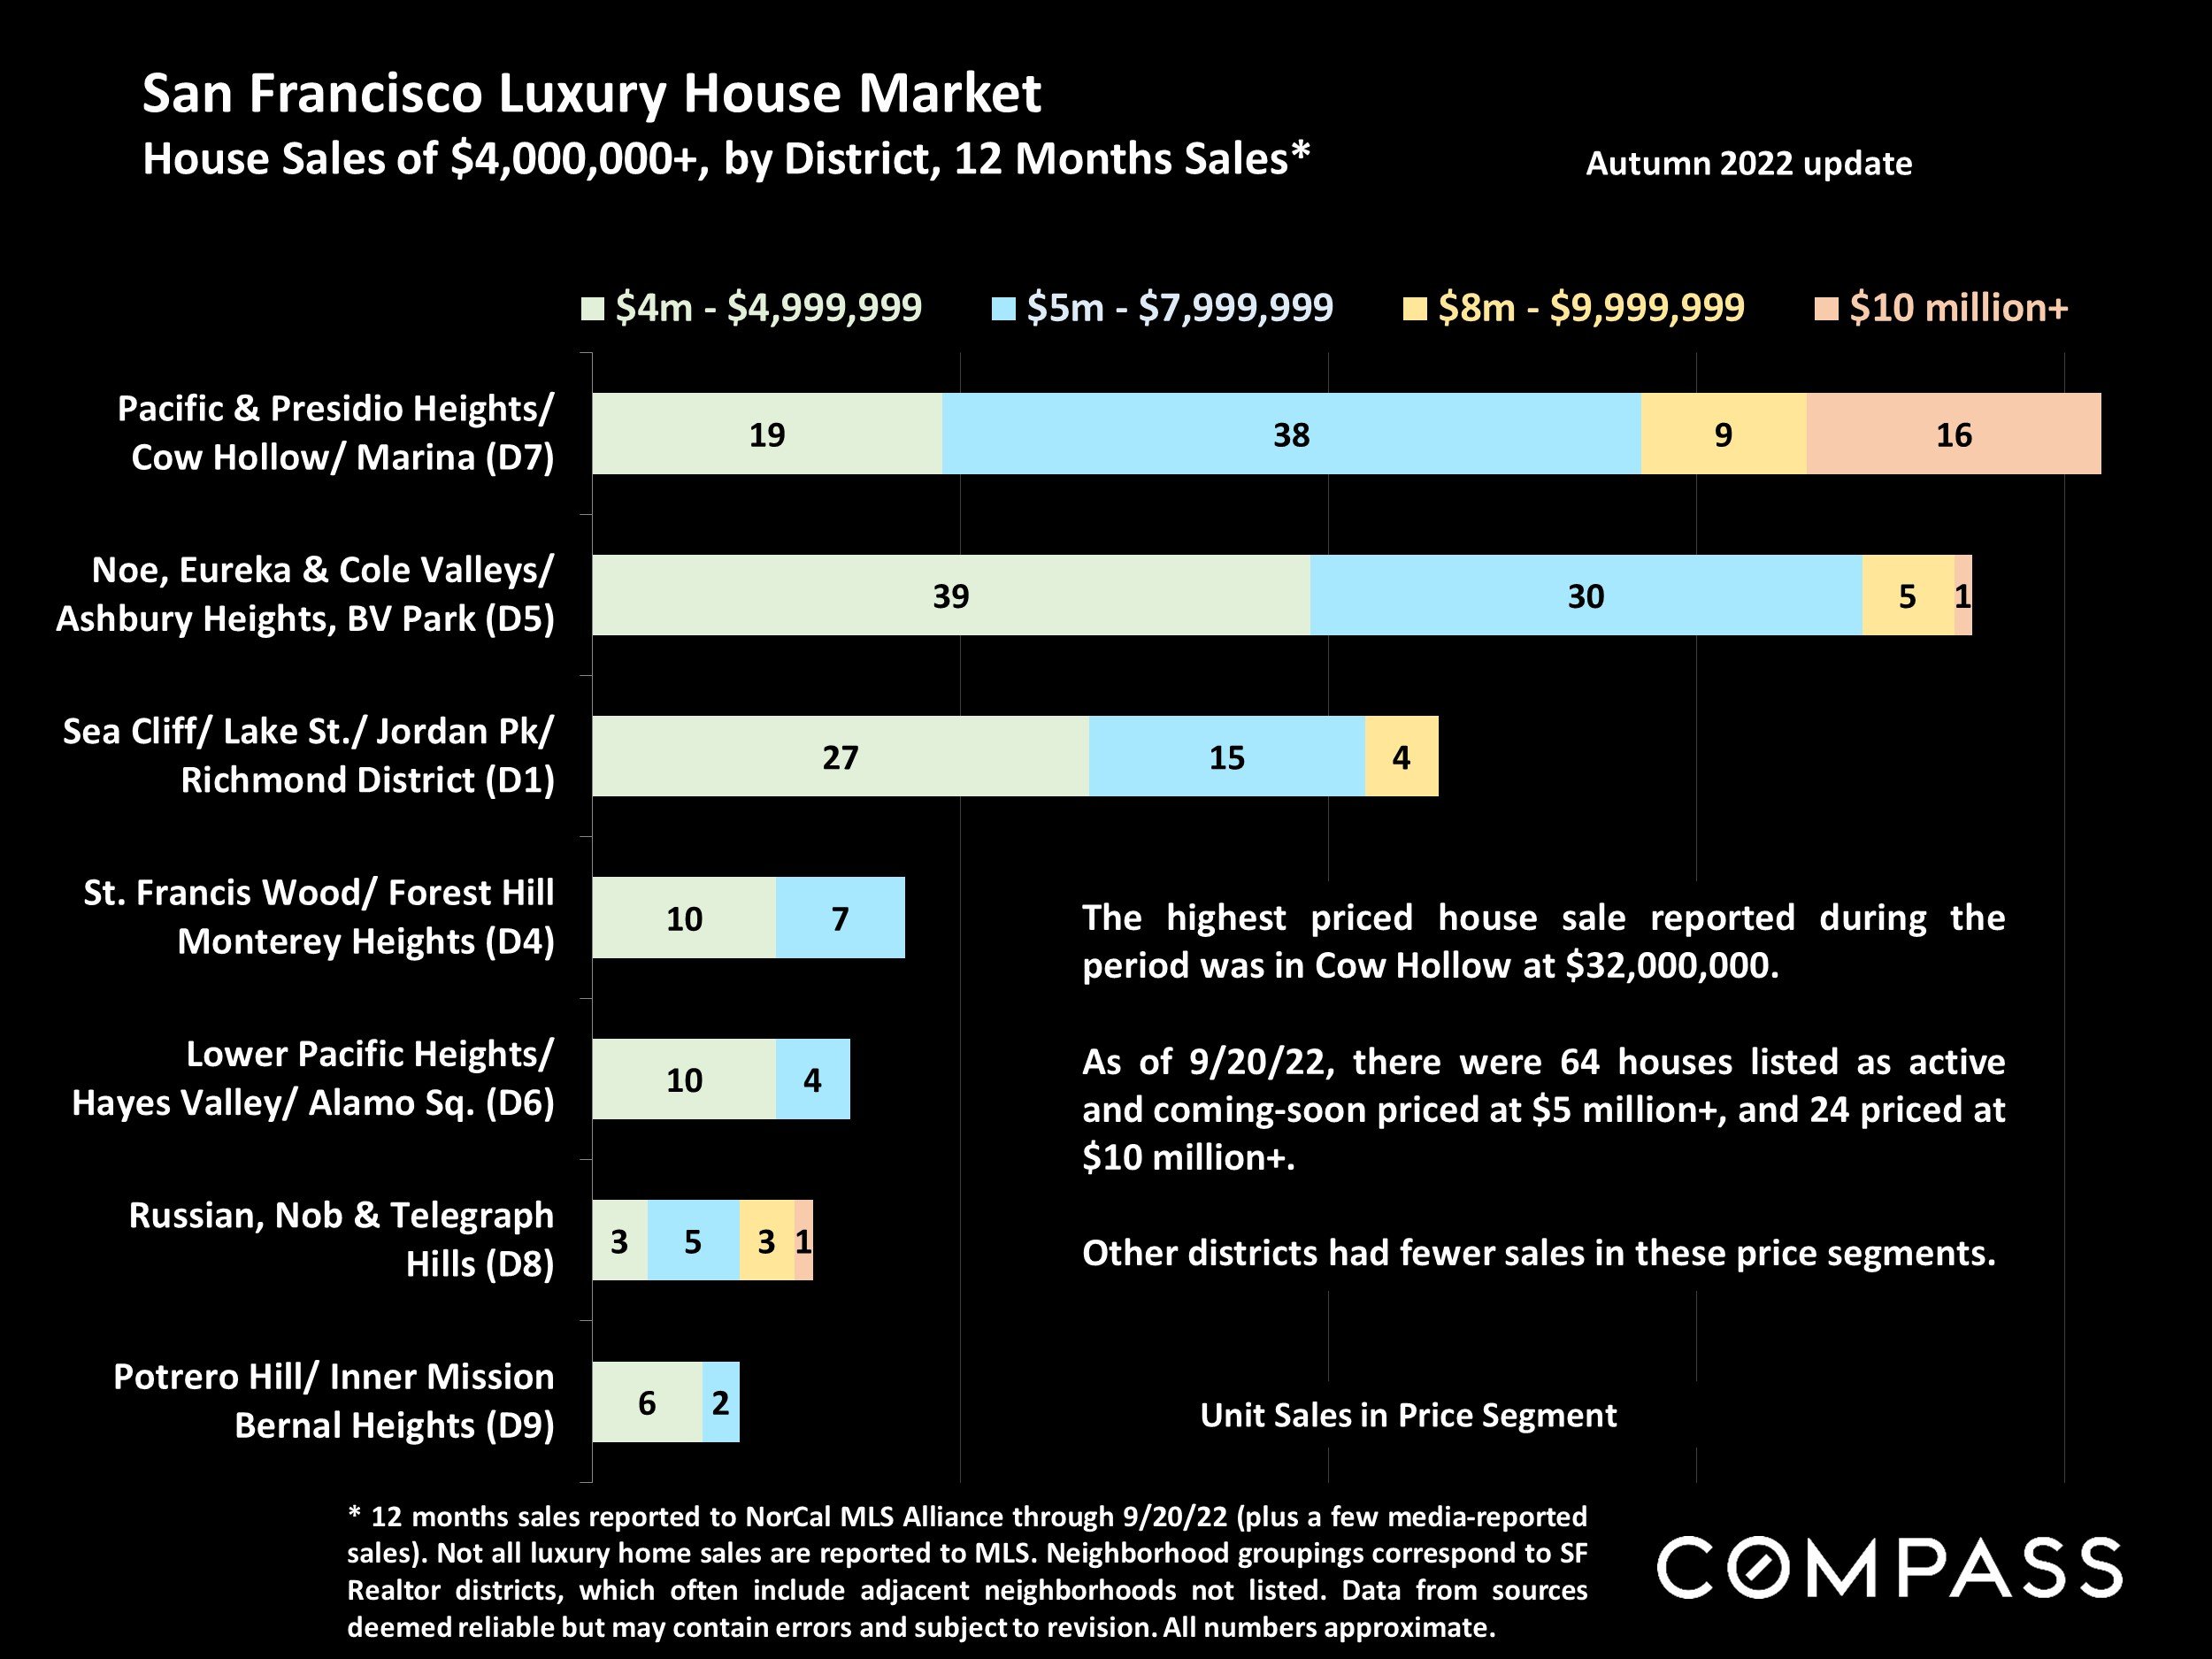
In the luxury house and condo market, the charts below shows where the sales are actually taking place. Keep in mind this is for the past 12 months.
So what is happening in the higher priced property segment? Volume is down from a historical perspective and I do not expect this to change by year end. But, this segment is hyper-sensitive to location; more specifically micro-location (within a neighborhood). You can slice up Pacific Heights (and other neighborhoods) into several highly different micro areas in terms of desirability, value and demand. One side of a block (vs. the other) can make or break a sale in the higher priced segment.
Considering life outside of San Francisco (or moving back to San Francisco)? The chart below will give you a good perspective on what you will have to pay in various Bay Area counties for a similar size property.


